
The science, explained: Norms
A score compared with whom?
The growth chart in a baby's red book: a height means nothing until you compare it with children the same age. Scores work the same.
The short answer
Norms
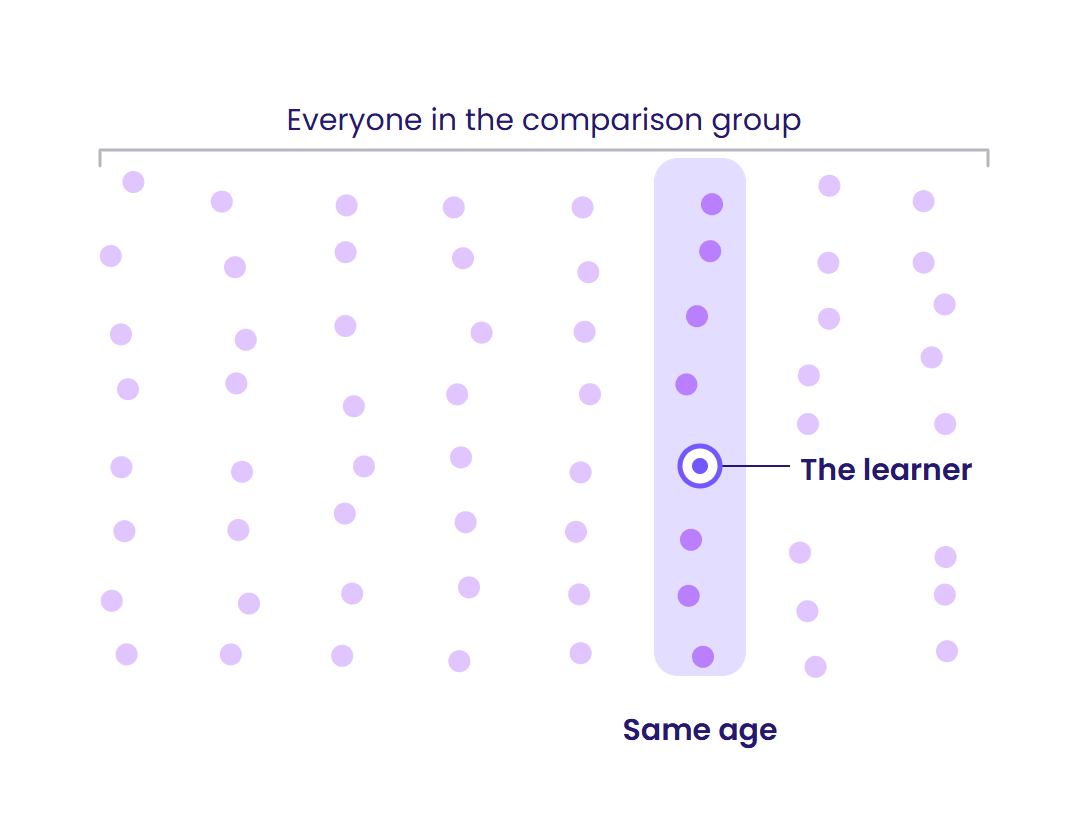
A score means nothing on its own; it means something when it is compared with people like the learner. That comparison group is the norm sample, and its size and make-up decide whether the comparison is fair. On the growth chart, the children the same age are the comparison group.
The same result can mean different things
A 5k time means something different at 25 and at 65. A time that is ordinary for a 25-year-old is impressive at 65, so you compare runners of the same age. A learner's score works the same way, which is why scores are compared by age.
What the science calls it
Three terms you may see in a report
The growth chart and the 5k time have already shown you the idea. These are the names the science gives to what they showed.
- Norm sample
- The group of people every score is compared with, like the children on the growth chart. Also called the normative sample or the standardisation sample.
- Norms
- What is typical in that group, the yardstick a learner's score is read against.
- Age norms
- Comparing a learner with people of the same age in that group, as you would compare 5k runners of the same age.
Why it matters before you act on a score
It decides what "below the typical range" means. The group a learner is compared with sets what is typical. Against the wrong group, the result says more about the group than the learner. A low score is a prompt to look closer, never a verdict. What does a score of 84 actually mean?
Ask any assessment, ours included. Who are the scores compared with, and how many of them? Are they people like your learners? It's a fair question to put to any assessment before you choose or use one.
Size and make-up both count. A big group of the wrong people is still the wrong comparison, and the right people in too small a group give a shaky one. A fair comparison needs both.
How our assessment measures up
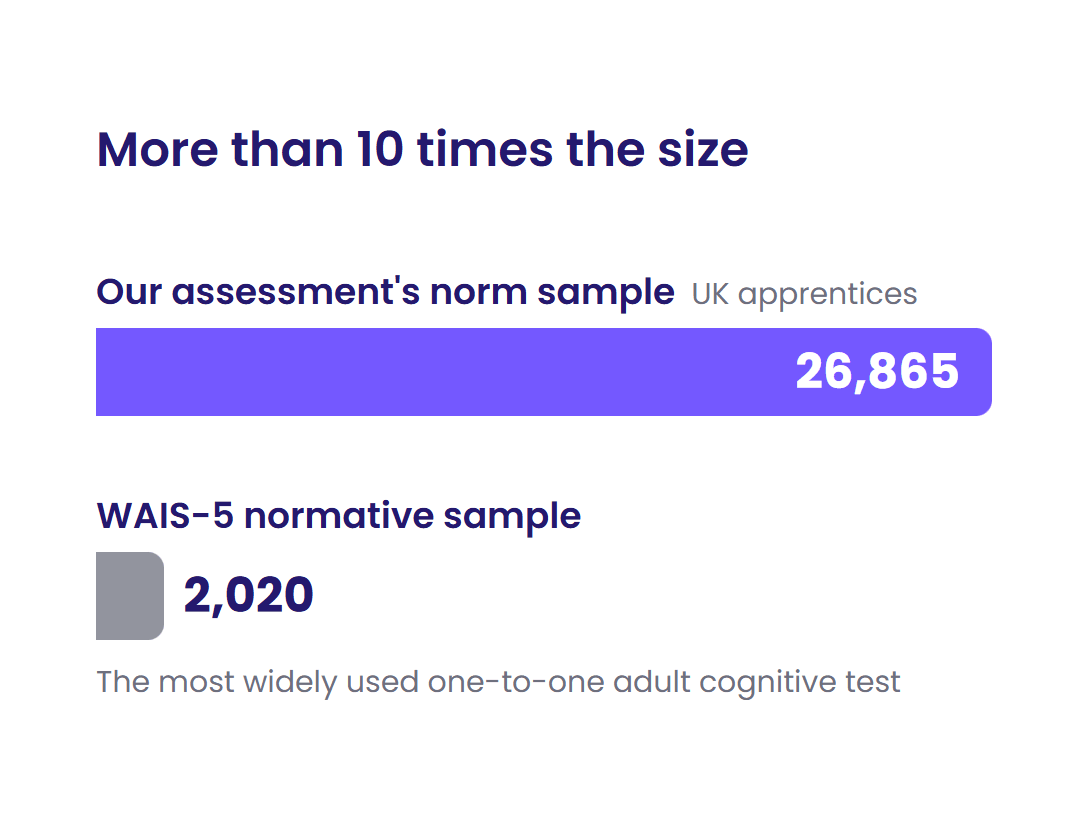
Our assessment compares each learner with 26,865 UK apprentices
They are UK apprentices of working age, with an average age of 29.4 and 60% female, drawn from 42,484 learners assessed through training providers. The group keeps growing through routine use, with checks before anyone new is added, so the comparison stays current.
- The size: more than 10 times the normative sample of the Wechsler Adult Intelligence Scale, fifth edition (WAIS-5), the most widely used one-to-one adult cognitive test, which was normed on 2,020 people.
- Age: every score is adjusted for age, so a learner is read against what is typical at their age, not the group's average. The adjustment is checked, and re-checked as the group grows.
- What that means for you: the score you see compares your learner with people their age in a large UK group. It's a prompt to look closer, never the only basis for a support decision.
Questions tutors ask
My learners are younger than the norm sample's average age. Are they compared with older people?
No. The group's average age is 29.4, but every score is adjusted for age, so a learner is compared with what is typical at their own age, as a 5k runner is. The adjustment is checked: once it is made, age no longer moves the scores. The score you see has already done this, so read it as it stands, beside what you know of the learner.
Is the norm sample everyone who has taken the assessment?
No. It is a defined comparison group of 26,865 UK apprentices, drawn from 42,484 learners assessed through training providers. New people join it through routine use, and each is checked before being added, so the comparison stays sound as it grows.
Does a bigger norm sample mean a better assessment?
Not on its own: size and make-up both count. And who a score is compared with is one question among several. Beside it sit reliability, whether the scores are consistent, and validity, whether they measure what they say they measure. Ask about all three.