Cognitive assessment: why we measure by age
Cognition and age are closely related – we see it in the data!
The link between cognitive assessment and age is an important one. An occasional misunderstanding we see is thinking that there is a kind of objective benchmark that we use to understand and measure someone’s cognition – like a set threshold that people should score above.
But because we don’t have a user manual of what the mind ‘should’ be like, we can only compare each individual against other people in the population.
This means the threshold for detecting neurodiversity is always relative.
But how do we decide who to compare each person to?
The crucial factor is age.
It’s obvious that we shouldn’t compare adults to children. But it’s less obvious that adults’ minds change over time too.
For example, it’s normal for our visual information processing speed to peak at around age 25 to 30, then gradually slow down from there (sad but true).
This means that, to better understand your cognitive profile, we need to compare you to people of your own age because what counts as a neurodiverse score is different for each age.
Below is a graph of our own data.
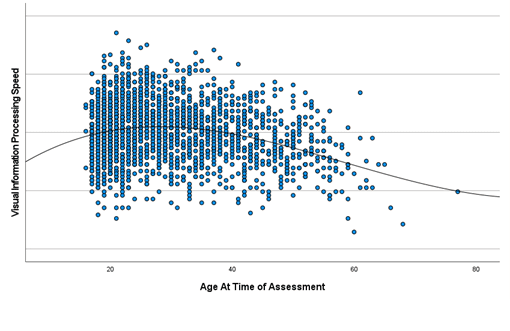
It shows how one of our domains, Visual Information Processing Speed (VIPS), changes in people of different age.
The blue dots represent people who have taken the Cognassist digital assessment and the black curved line through the middle represents a standard score of 100 – the average at each age.
As we expect, the peak is around age 30, then tapers off (this is one of the ways we know that this task is working properly – it matches decades of research).
Looking at the graph, it would be inaccurate to compare someone aged 50 to someone aged 30. The 50 year old will probably score lower, but not necessarily to a level that is unexpected or neurodiverse.
So how does this work with standard scoring?
Standardised scores are a way of creating relative benchmarks to measure performance and are common measures in education.
A standard score of 85 is commonly used when identifying a need because this score is one standard deviation below the mean.
Standard deviations are useful measures because a score below one standard deviation from the mean (84 and below) suggests that a person’s score differs from the population average more than a significant majority of people.
In a cognitive assessment, a lower score will indicate a person having difficulties with this cognitive domain and it is likely they will require support for tasks involved in this area of cognition.
So to go back to our visual information processing speed example, a 30 year old could get 100 questions right on the VIPS domain, which might be a standard score of 85. But a 50 year old could get 80 VIPS questions right, which would also be a standard score of 85. These numbers are examples only, but the mean, and therefore one standard deviation from the mean, are always relative to each age bracket.
To accurately identify where people need support, we have to ask the question, “Is our score different when compared to similar people?”
Understanding how individuals think and learn at different stages of their life is incredibly important to providing effective support and inclusive learning environments grounded in the scientific research of cognition and education.
And we know that our cognition naturally changes over time and not always in a downward direction, you’ll be pleased to know!

Helen
Science Communications Manager
Get to know the science
Understanding neurodiversity and cognition is an essential tool to deliver the best support for your learners.
In this guide, we outline the background of Cognassist’s digital cognitive assessment and our basis of validity.
And explain how we ensure, with scientific accuracy, that no learner is left behind.